How Progressive Jackpot Linkages Shape Risk Thresholds in Networked Slot Ecosystems
Written by Harper Perry · Aug 13, 2026
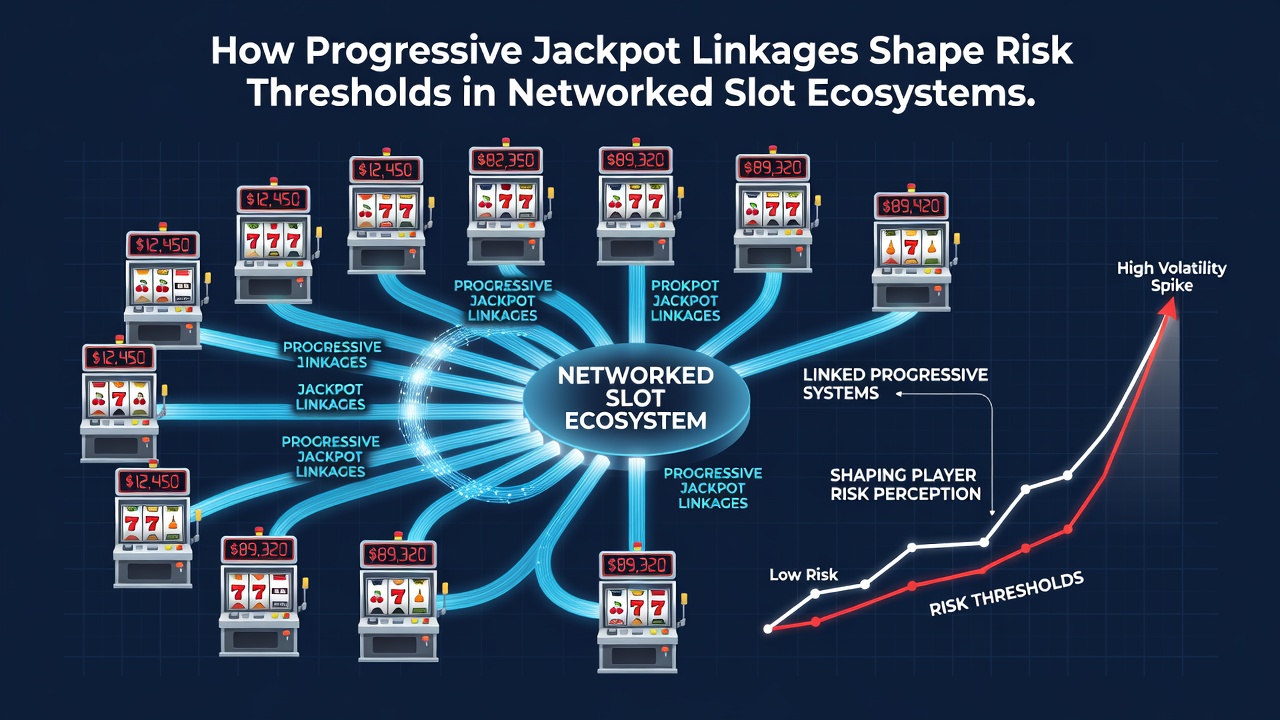
How Progressive Jackpot Linkages Shape Risk Thresholds in Networked Slot Ecosystems
Progressive jackpot linkages connect individual slot machines into shared prize pools that span multiple venues and platforms, and this structure directly alters the mathematical risk profiles that define player exposure in digital and land-based environments. Contributions from each wager feed into a central meter, which grows until triggered, while the base game return-to-player percentages adjust to accommodate the linkage fees. Observers note that these networks create variance patterns distinct from standalone machines because the infrequent but substantial payouts redistribute risk across thousands of sessions rather than concentrating it within single units.
Mechanics Behind Linked Prize Pools
Network operators allocate a fixed percentage of each bet to the progressive component, and this allocation varies by jurisdiction yet consistently reduces the immediate payout frequency of the base game. Researchers have documented how the linkage fee typically ranges between one and three percent, which shifts the hit frequency of smaller wins downward while elevating the ceiling on the top prize. In August 2026 several major networks reported meter growth rates exceeding previous quarters because cross-platform integration allowed contributions from both online and retail terminals to merge into unified pools.
Software providers manage the randomization engines that determine when a jackpot triggers, and certification labs verify that the combined probability remains consistent across all connected devices. Data shows the trigger probability scales inversely with the number of machines in the network, which means larger ecosystems produce rarer but bigger wins. Those who track these systems point out that the effective volatility index rises because players encounter longer dry spells punctuated by outsized rewards.
Adjustments to Player Risk Thresholds
Players face altered bankroll requirements once they engage with linked progressives, since the increased variance demands greater reserves to weather extended sequences without returns. Studies from academic gaming labs indicate that session lengths must extend by thirty to fifty percent on average to reach the same expected value compared with non-progressive titles. Regulators in multiple regions require disclosure of these adjusted parameters so participants understand the trade-off between jackpot size and payout regularity.
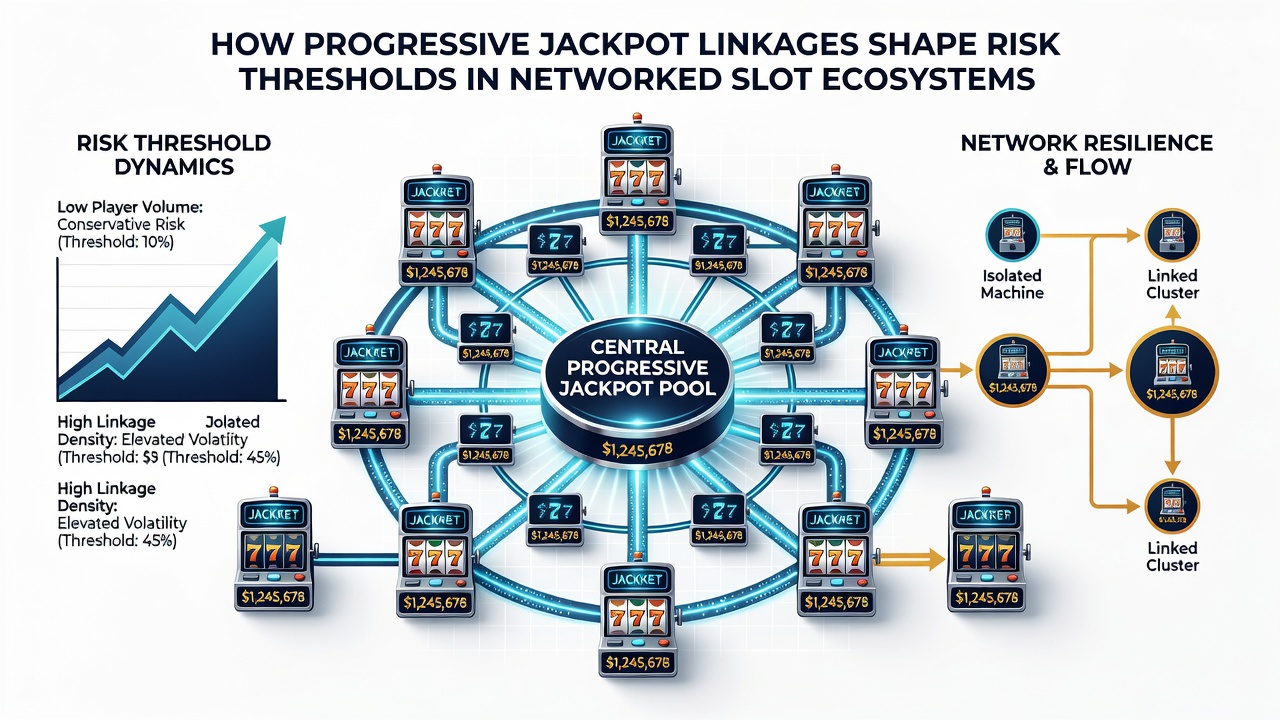
Bankroll allocation models adapt accordingly, with analysts recommending higher minimum stakes thresholds before entry into linked ecosystems becomes statistically viable. The reality is that smaller wagers on these machines yield proportionally smaller contributions to the meter, yet the absolute risk per spin remains elevated due to the diverted percentage. Figures from industry monitoring services reveal that players who maintain fixed session budgets encounter earlier depletion rates when the linkage fee exceeds two percent.
Network Scale and Variance Amplification
Wider networks magnify these effects because each additional machine dilutes the trigger probability while accelerating meter growth. Operators balance this by tiering jackpot levels, creating minor, major, and grand prizes that reset at different intervals. Evidence from operational reports demonstrates that multi-tier structures moderate extreme variance spikes, although the grand prize component still dominates the overall risk equation. Pennsylvania gaming reports and data released by the Australian Gambling Research Centre both confirm that networks exceeding five thousand terminals exhibit measurable increases in session standard deviation.
Software updates in 2026 introduced dynamic linkage fees that respond to meter velocity, allowing systems to stabilize risk thresholds when growth accelerates beyond preset bands. Such adjustments keep the effective return within regulatory corridors while preserving the appeal of accumulating prizes. Those monitoring compliance note that these real-time calibrations require continuous auditing to prevent drift in the underlying probability models.
Regulatory Oversight and Reporting Standards
Authorities mandate monthly submissions detailing meter contributions, trigger frequencies, and realized payout distributions from every linked network. These filings enable comparison across jurisdictions and highlight how linkage density correlates with shifts in player loss rates. One analysis of Nevada records showed networks with higher machine counts produced elevated average losses per session despite identical base RTP settings. Similar patterns appear in Canadian provincial data, underscoring the consistent influence of scale on risk exposure.
Certification protocols now incorporate stress testing for extreme jackpot scenarios, ensuring that payout mechanisms remain solvent even when multiple high-tier triggers occur within short windows. Industry groups coordinate with academic researchers to refine simulation models that forecast long-term variance under various linkage configurations. The resulting datasets inform both operator reserve requirements and player education materials distributed at regulated sites.
Conclusion
Progressive jackpot linkages reshape risk thresholds by redistributing payout probability across expansive networks, which lengthens intervals between wins while elevating maximum prize values. Operators adjust contribution rates and tier structures to maintain compliance, and regulators track these parameters through mandatory reporting. Data from sources such as the Nevada Gaming Control Board and the Australian Gambling Research Centre continue to quantify these dynamics, providing objective benchmarks for how network size and fee allocation modify the statistical landscape of slot play. As integration expands, the interplay between meter velocity and variance remains a central factor in ecosystem design.